SUMMER 2024
To compare dynamics of chromatin states during NSC differentiation between humans and chimpanzees, I tried to make DNA sequencing libraries for Assay for Transposase Accessible Chromatin and sequencing (ATAC-seq). To this end, human and chimpanzee iPSCs were cultured, then differentiated into NSCs by changing the media that directed differentiation. Since mature NSCs appear at around day 10 after differentiation and ATAC-seq data for day 0 and 6 have been already analyzed by Suzuki, I collected cells at day 8 and 10 of differentiation, prepared libraries by using a commercially available ATAC-seq kit. The DNA yields of these libraries for the day 8 NSCs were 8.48 to 14.8 ng/ul, which were in the expected range. In contrast, the yields for day 10 were much lower than expected and deemed unusable. Because of the time limitation, I was not able to perform more ATAC-seq analysis or gather the sequencing data, so I moved onto establishment of the protocol for NSC differentiation of gibbon iPSCs as described below.
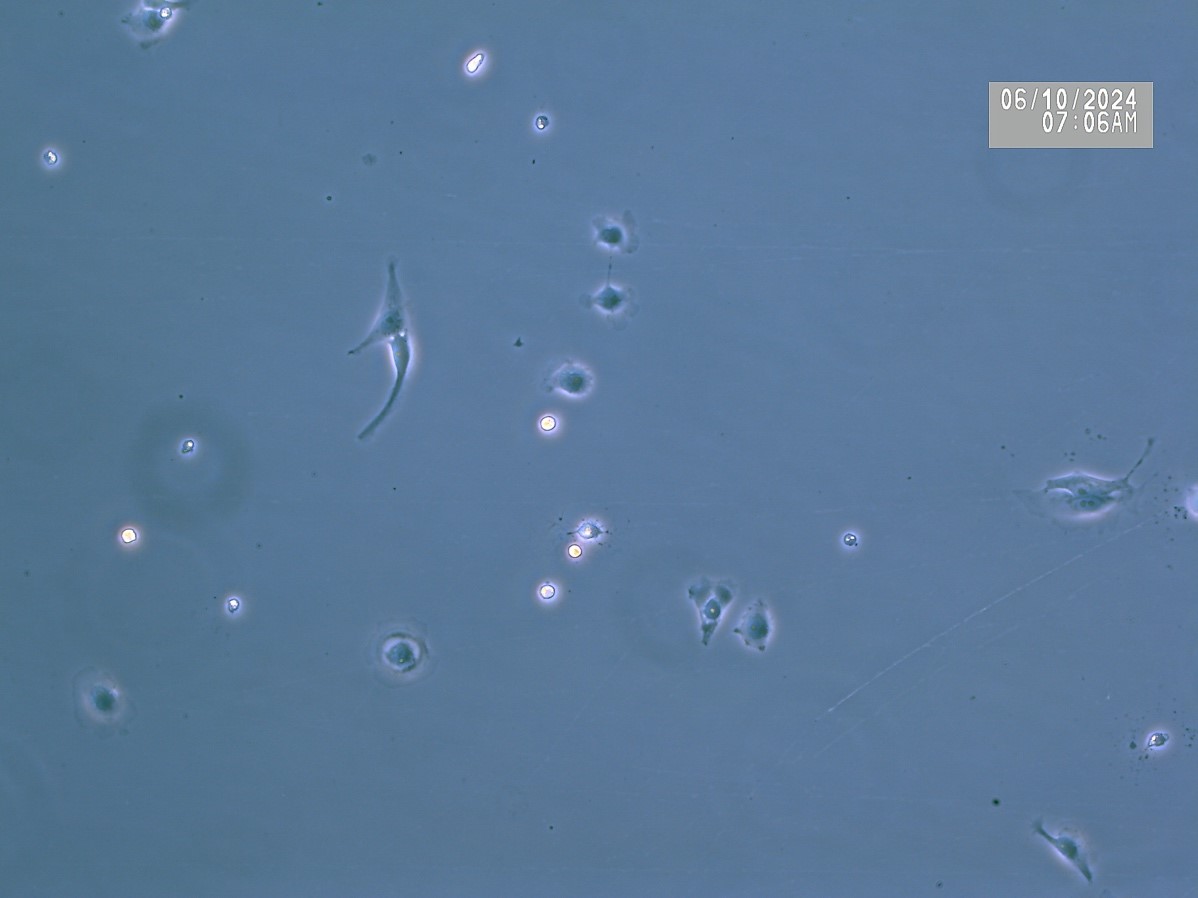
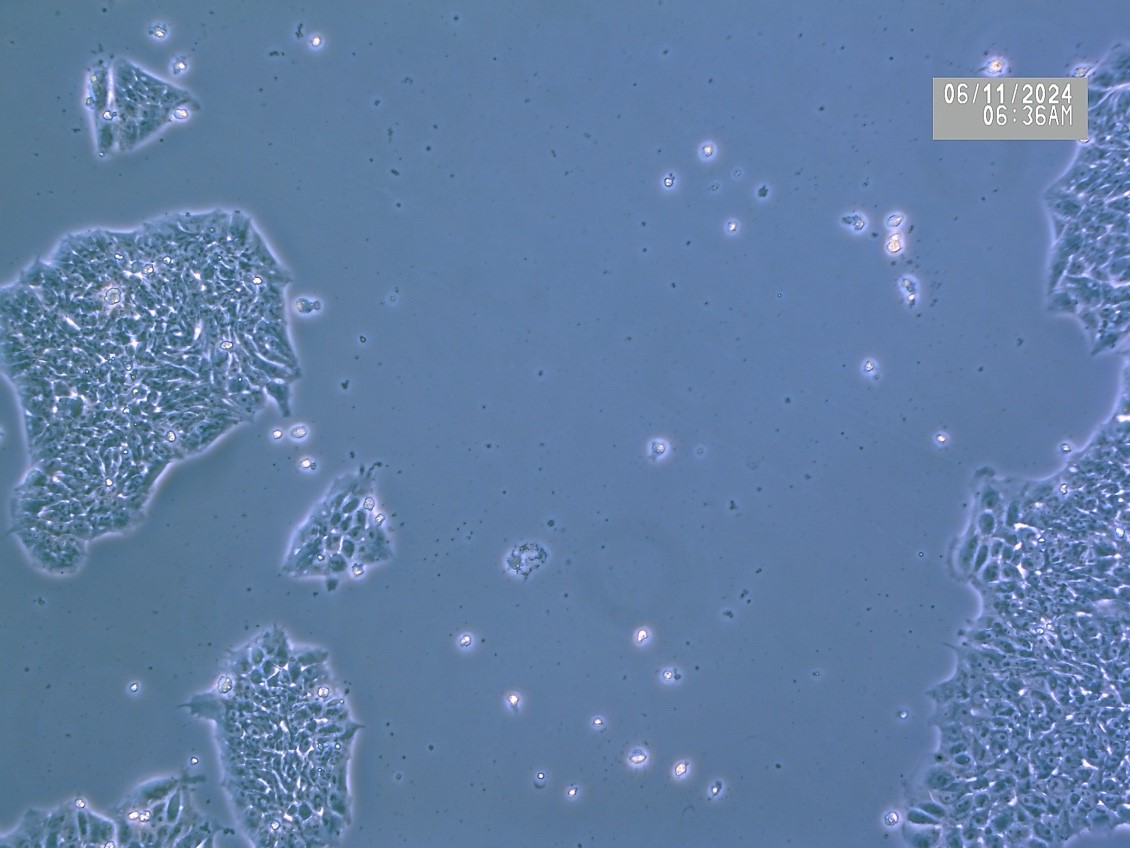
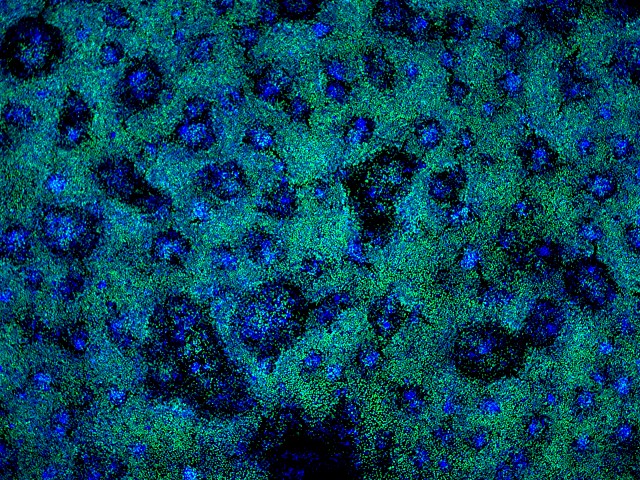
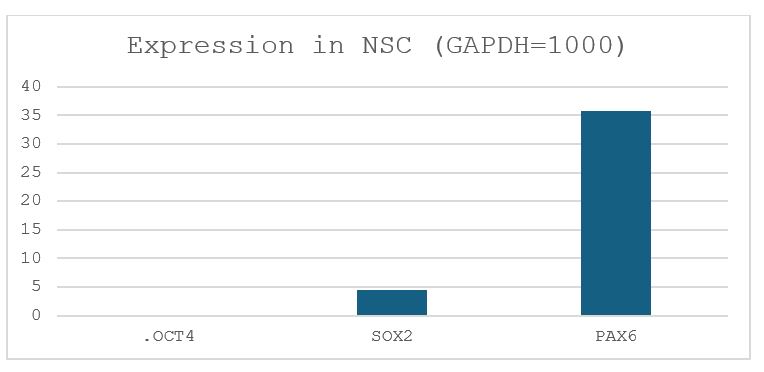
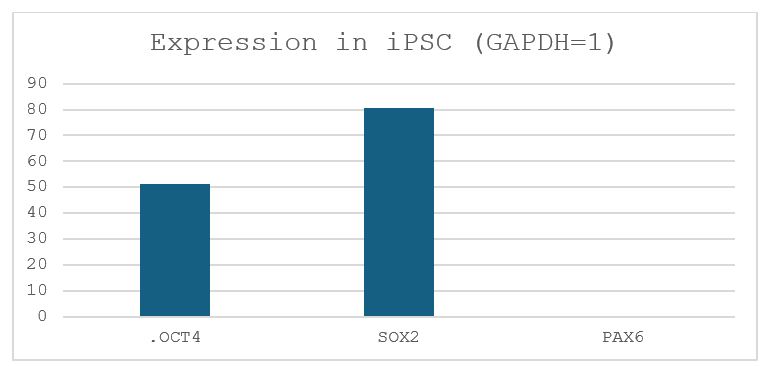
Gibbons diverged from Hominidae (human, chimpanzee, bonobo, gorilla, and orangutan) about 18 million years ago, and therefore can be used as an outgroup when human and chimpanzee are compared. Even though gibbon iPSCs have been generated, the protocol for generating NSCs from gibbon iPSCs has not been established. Suzuki was gifted gibbon iPSCs from Dr. x and wanted to know if his differentiation protocol for the human and chimpanzee iPSCs would work. Thus, I cultured gibbon iPSCs in Stemfit (picture shown in Fig. 2) and transferred them into the NSC differentiation media. After 8 days of incubation (picture shown in Fig. 3), RNA was extracted from the cells, and the expression levels of the GAPDH, OCT4 (POU5F1), SOX2 and PAX6 genes were analyzed by reverse-transcription quantitative PCR (RT-qPCR) (Fig. 6). Whereas OCT4 and SOX2 were highly expressed in gibbon iPSCs, OCT4, a maker of pluripotency, was significantly downregulated after differentiation. Instead, the expression of PAX6, a maker for neurogenic cells, was significantly increased, suggesting that differentiation took place in the desired direction. Because qPCR does not give the fraction of cells expressing PAX6, I performed immunostaining of the differentiated cells against the anti-SOX2 antibody (Fig. 4). Nuclei of many cells were positive for SOX2; however, SOX2-negative nuclei were also present, suggesting that not all cells differentiated into NSCs. Moreover, SOX2 expression does not necessarily mean that the iPSC differentiated into a NSC.
The next step of my project was to continue to monitor the gibbon iPSCs and differentiate them so that it was certain Suzuki’s protocol was accurate and delivered proper NSCs. After confirming gibbon iPSC differentiation, ATAC-seq analysis was to be conducted and the data compared to existing libraries. It was also planned that I would perform the bioinformatic analysis on the ATAC-seq libraries using the university computer, but there was not enough time.
| NSC | Day 8 | Day 10 |
| Kiku | 14.8 ng/μl | 13.9 ng/μl |
| Mari | 8.48 ng/μl | 0.218 ng/μl |
| 409 | NA | 0.428 ng/μl |
| NIPS | NA | Too low to detect |
This table represents the DNA yield after ATAC-seq library amplification via PCR. These values were calculated with the Qubit machine.
Research Pack Abroad provides undergraduate students international research experience – working side-by-side with scientists and immersed in another culture. Students are connected with a host international research institution, where they conduct research for at least 2 months during the summer.