Bullish Surprise for Corn and Soybeans with Prospective Plantings
Written by Nick Piggott for the NC Corn Growers Association
 The USDA’s Prospective Planting report released on March 31, 2021 provided a bullish surprise to corn and soybean markets. The estimated corn acres intentions of 91.1 million acres and soybean acres intentions of 87.6 million acres were both below trade expectations and USDA Agricultural Outlook Forum projections. In response, the new crop futures for corn (December 2021) closed limit-up (25 cents per bushel) at $4.771/2 per bushel, and the new crop soybeans (November 2021) closed limit-up (70 cents per bushel) at $12.561/4 per bushel the day of the report. The combined total of planting intentions for corn and soybeans is 178.7 million acres and is 3.3 million acres less than the record level Agricultural Outlook Forum projection on February 19, 2021 of 182 million acres (92 million corn acres + 90 million soybean acres).
It is essential to highlight that these planting intentions are projections based on farmer surveys of how many acres they expect to plant. That is, actual planted acres can and will change due to changes in market conditions and weather during planting. The limit-up trading for new crop contracts for corn and soybean in response to the report was an example of changing market conditions. Both corn and soybean markets were trying to bid more acres by increasing new crop futures.
Understanding what these prospective planting estimates mean moving forward can be helped by examining how actual planted acres compare with prospective planting acres over time. The distribution of actual planted corn acres minus prospective planting corn acres (the difference) calculated over the period 1990-2020 reveals that actual corn acres averages about 0.5 million acres less than intentioned acres, with the 5th percentile of 3.8 million acres less and 95th percentile of 1.9 million acres more than intentions. The distribution of actual planted soybean acres minus prospective planting soybean acres (the difference) calculated over the period 1990-2020 reveals that actual soybean planted acres averages about 0.1 million acres less than intentioned acres, with the 5th percentile of 2.6 million acres less and the 95th percentile of 2.1 million acres more than intentions. Thus, the empirical evidence of 30 years suggests that actual planted acres tend to be slightly less than prospective planting acres, but variations are also considerably below and above. The market will be trading, and the balance sheets must account for this uncertainty of actual planted acres over the next several months (see Table 1 for corn).
The post Prospective Planting report limit-up closes for new crop corn and soybean futures signal that the current momentum is for higher corn and soybean prices to bid more planted acres and encourage farmers to plant more acres beyond their current intentions. The higher prices will also ration demand if current intentions eventuate. The next update to planted acres will be in the June acreage report. So be prepared for a volatile ride as the markets trade this uncertainty, especially if there is anything but perfect planting weather, which will push markets even higher.
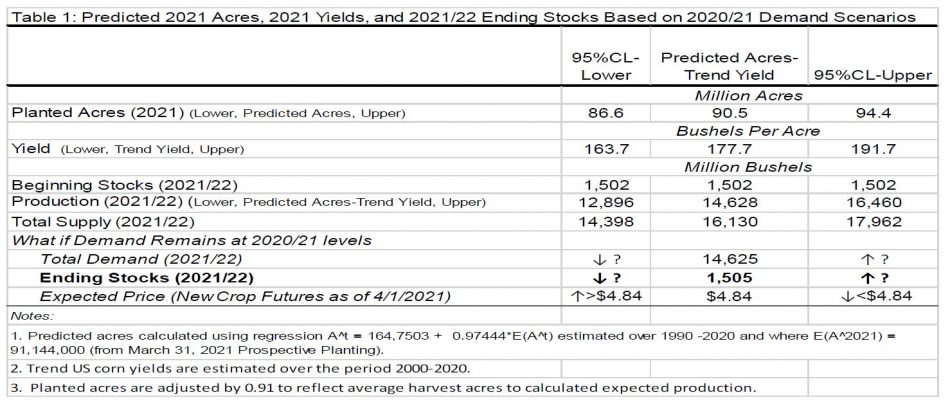
With our first insights into 2021 corn planting intentions, it is illuminating to begin predicting the 2021/22 balance sheets and what it might mean for prices into 2021/22. In Table 1, I have attempted to do this for corn by constructing a prediction of 2021 corn production using the corn planting intentions estimate of 91.444 million acres and the relationship between actual planted acres and planting intentions over the period 1990-2020. Doing so resulted in the prediction of 90.5 million planted acres in 2021 with 95% confidence limits lower bound of 86.6 million acres and an upper bound of 94.4 million acres. Next, using US corn yields over the period 2000-2020, I projected a trend yield for corn in 2021 of 177.7 bushels per acre with a 95% confidence limits lower bound of 163.7 bushels per acre and an upper bound of 191.7 bushels per acre. The 2021 production prediction is then estimated by adjusted the predicted planted acres by 0.91 to reflect average harvested acres and multiplying by the predicted yields. The prediction for 2021 production is 14,628 million bushels. The lower bound on this estimate is 12,896 million bushels and the upper bound is 16,460 million bushels. This expansive range of 3,564 million bushels between the upper and lower bounds for the production prediction reflects the significant uncertainty around predicted planted acres and expected 2021 corn yields.
Combining the prediction of 14,628 million bushels with the anticipated beginning stocks of 1,502 million bushels results in a predicted supply of 16,130 million bushels. If this were to eventuate, it would be on par with supply in 2020/21, but below 2016/17, 2017/18, and 2018/19 levels that averaged 16,882 million bushels. If the scenario of upper bound planted acres of 94.4 million acres and upper bound yields 191.7 bushels per acre were to occur, then the estimated supply would be 17,962 million bushels smashing the current record of 16,940 million bushels that occurred in 2016/17. Of concern is the prospect of realizing the lower bound planted acres of 86.6 million and yields of 163.7 bushels per acre with an estimated supply of a dismal 14,398 million bushels. A final step in sketching out the 2021/22 balance sheet is to consider demand scenarios for 2021/22 to predict ending stocks. A natural scenario is to consider demand in 2021/2022 remaining around 2020/21 levels, currently estimated to be 14,625 million bushels. This scenario is considered in Table 1, and it is estimated that it would lead to ending stocks of around 1,505 million bushels for 2021/22, close to 2020/21 ending stocks. Thus, maintaining current demand into the 2021/22 bushels would mean the predicted production in 2021/22 would be around just enough. Suppose lower production levels occur in 2021/22 with similar demand levels of 2020/21, as shown in the lower bound scenario. In that case, ending stocks will be less than 1,505 million bushels, and prices will rise above the current new crop futures level of $4.84 per bushel to ration demand. Conversely, if higher levels of production occur in 2021/22 levels with similar demand of 2020/21, as shown in the upper bound scenario, then ending stocks will be greater than 1,505 million bushels, and prices will decline below the current new crop futures level of $4.84 per bushel as ending stocks will be increasing.
In sum, the current momentum is for higher corn and soybean prices as the market bids for more planted acres and to ration demand to ensure some maintenance level of ending stocks in 2021/22 if current intentions eventuate. Pricing opportunities at profitable and even higher prices are on the horizon, especially if anything but perfect planting weather occurs. Market your expected production in increments on further futures price upswings and a strengthening basis.
- Categories: